Data Analyst | Data Storyteller | Dashboard Designer

Hi, I'm Shaheer

I create comprehensive visuals to help support data-driven decision making

About Me

From Extracting Raw Materials to Extracting Data

Unexpectedly, my data journey began during my first job at a mine site in rural Nova Scotia, Canada. Working at Atlantic Gold Corp, I discovered the power of data and a potential career path in data analytics. Here I am 2 years later happy to help others in this data ridden world of ours. 

As a mining engineering student at the University of British Columbia, I was constantly faced with ambiguous scenarios where I had to extract actionable insights from collected data. Determined to strengthen my data skills, I later pursued a data analytics capstone project for my degree requirement. We were tasked to compare autonomous vs conventional haulage with respect to GHG emissions. My team was awarded the UBC Mining Engineering APSC Design and Innovation Faculty Award for the top project. These experiences inspired me to use my data skills to help businesses streamline operations, increase efficiency and reduce costs. 

Skills:

Nova Scotia, Canada

My Skills

Data Analysis

Data exploration, application of statistical methods, and reproducible data analysis

Data Wrangling

Data formatting, data modeling, and data cleaning using tidy data rules

Data Visualization

Creation of static and interactive dataviz and dashboards

Data Communication

Interpreting data and relaying easily comprehensible stories

My Work

Power BI Report for Smart Devices

Investigated the viability of a smart fitness device for cats, based on data collected from existing prototypes.

Marketing Analytics for a Clothing Company

Data driven analysis to find the best products to advertise to customers.

Dashboard Design for Wind Power in the United States

Redesigned a visualization for wind power use in the US in 2018 using Tableau.

Analysis of Missed Medical Appointments

Explored characteristics that cause patients to miss their medical appointments based on a dataset from 100k appointments.

Survey Data Analysis

Extracted meaningful insights based on statistical analysis from cleaned Survey Data.

My Blog

Have a read through my articles below, showcasing the processes I used on my favorite data analytics projects

Certifications

Data Analysis

Introduction to Data Analysis, Practical Statistics, Data Wrangling and Data Visualization
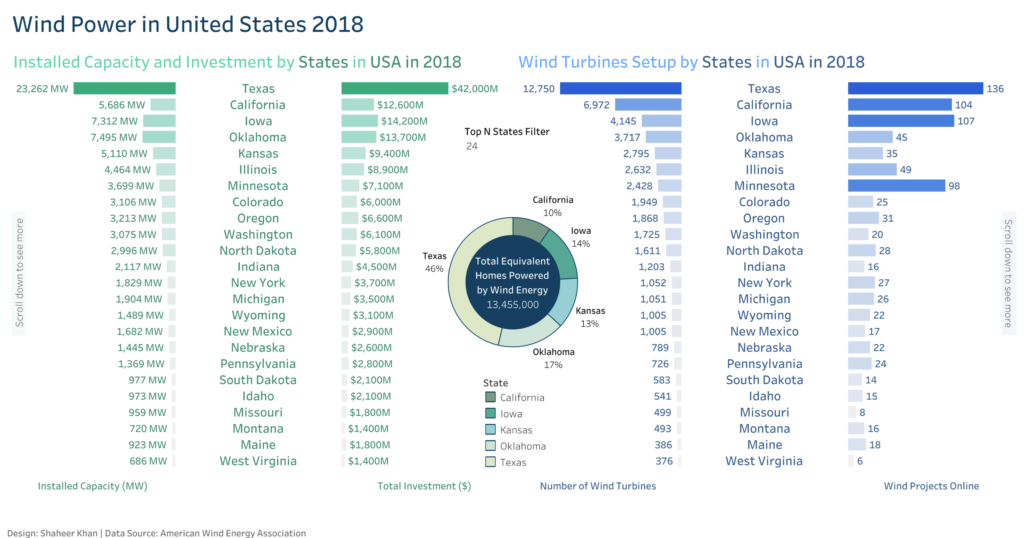
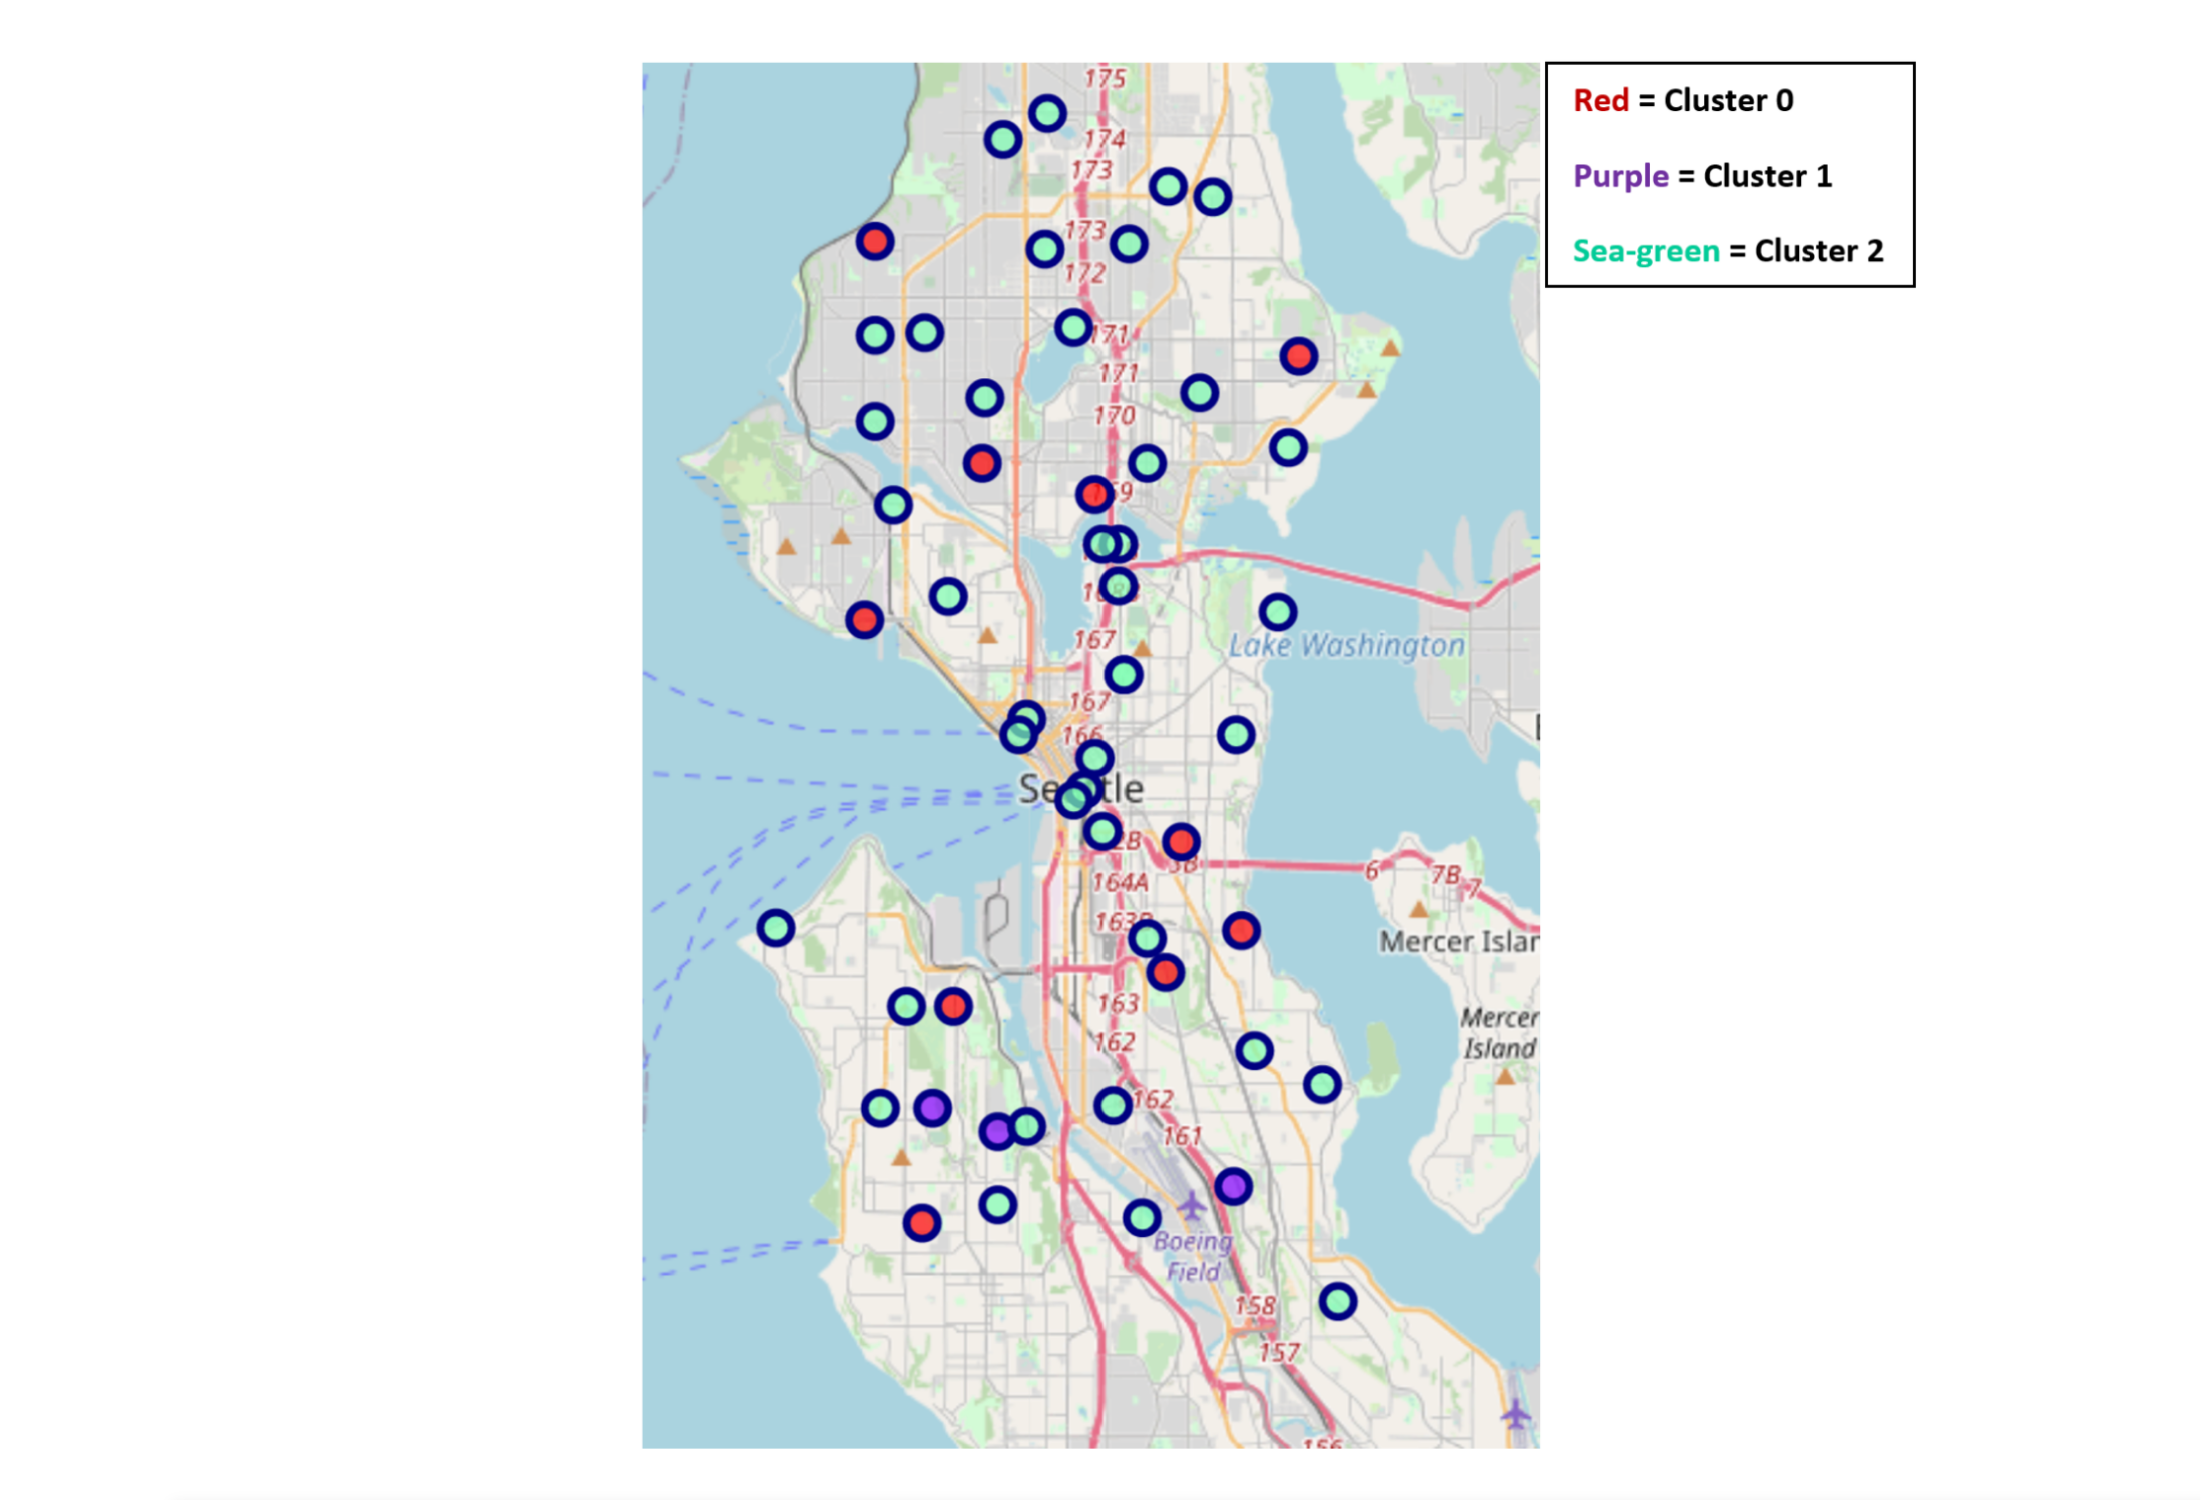
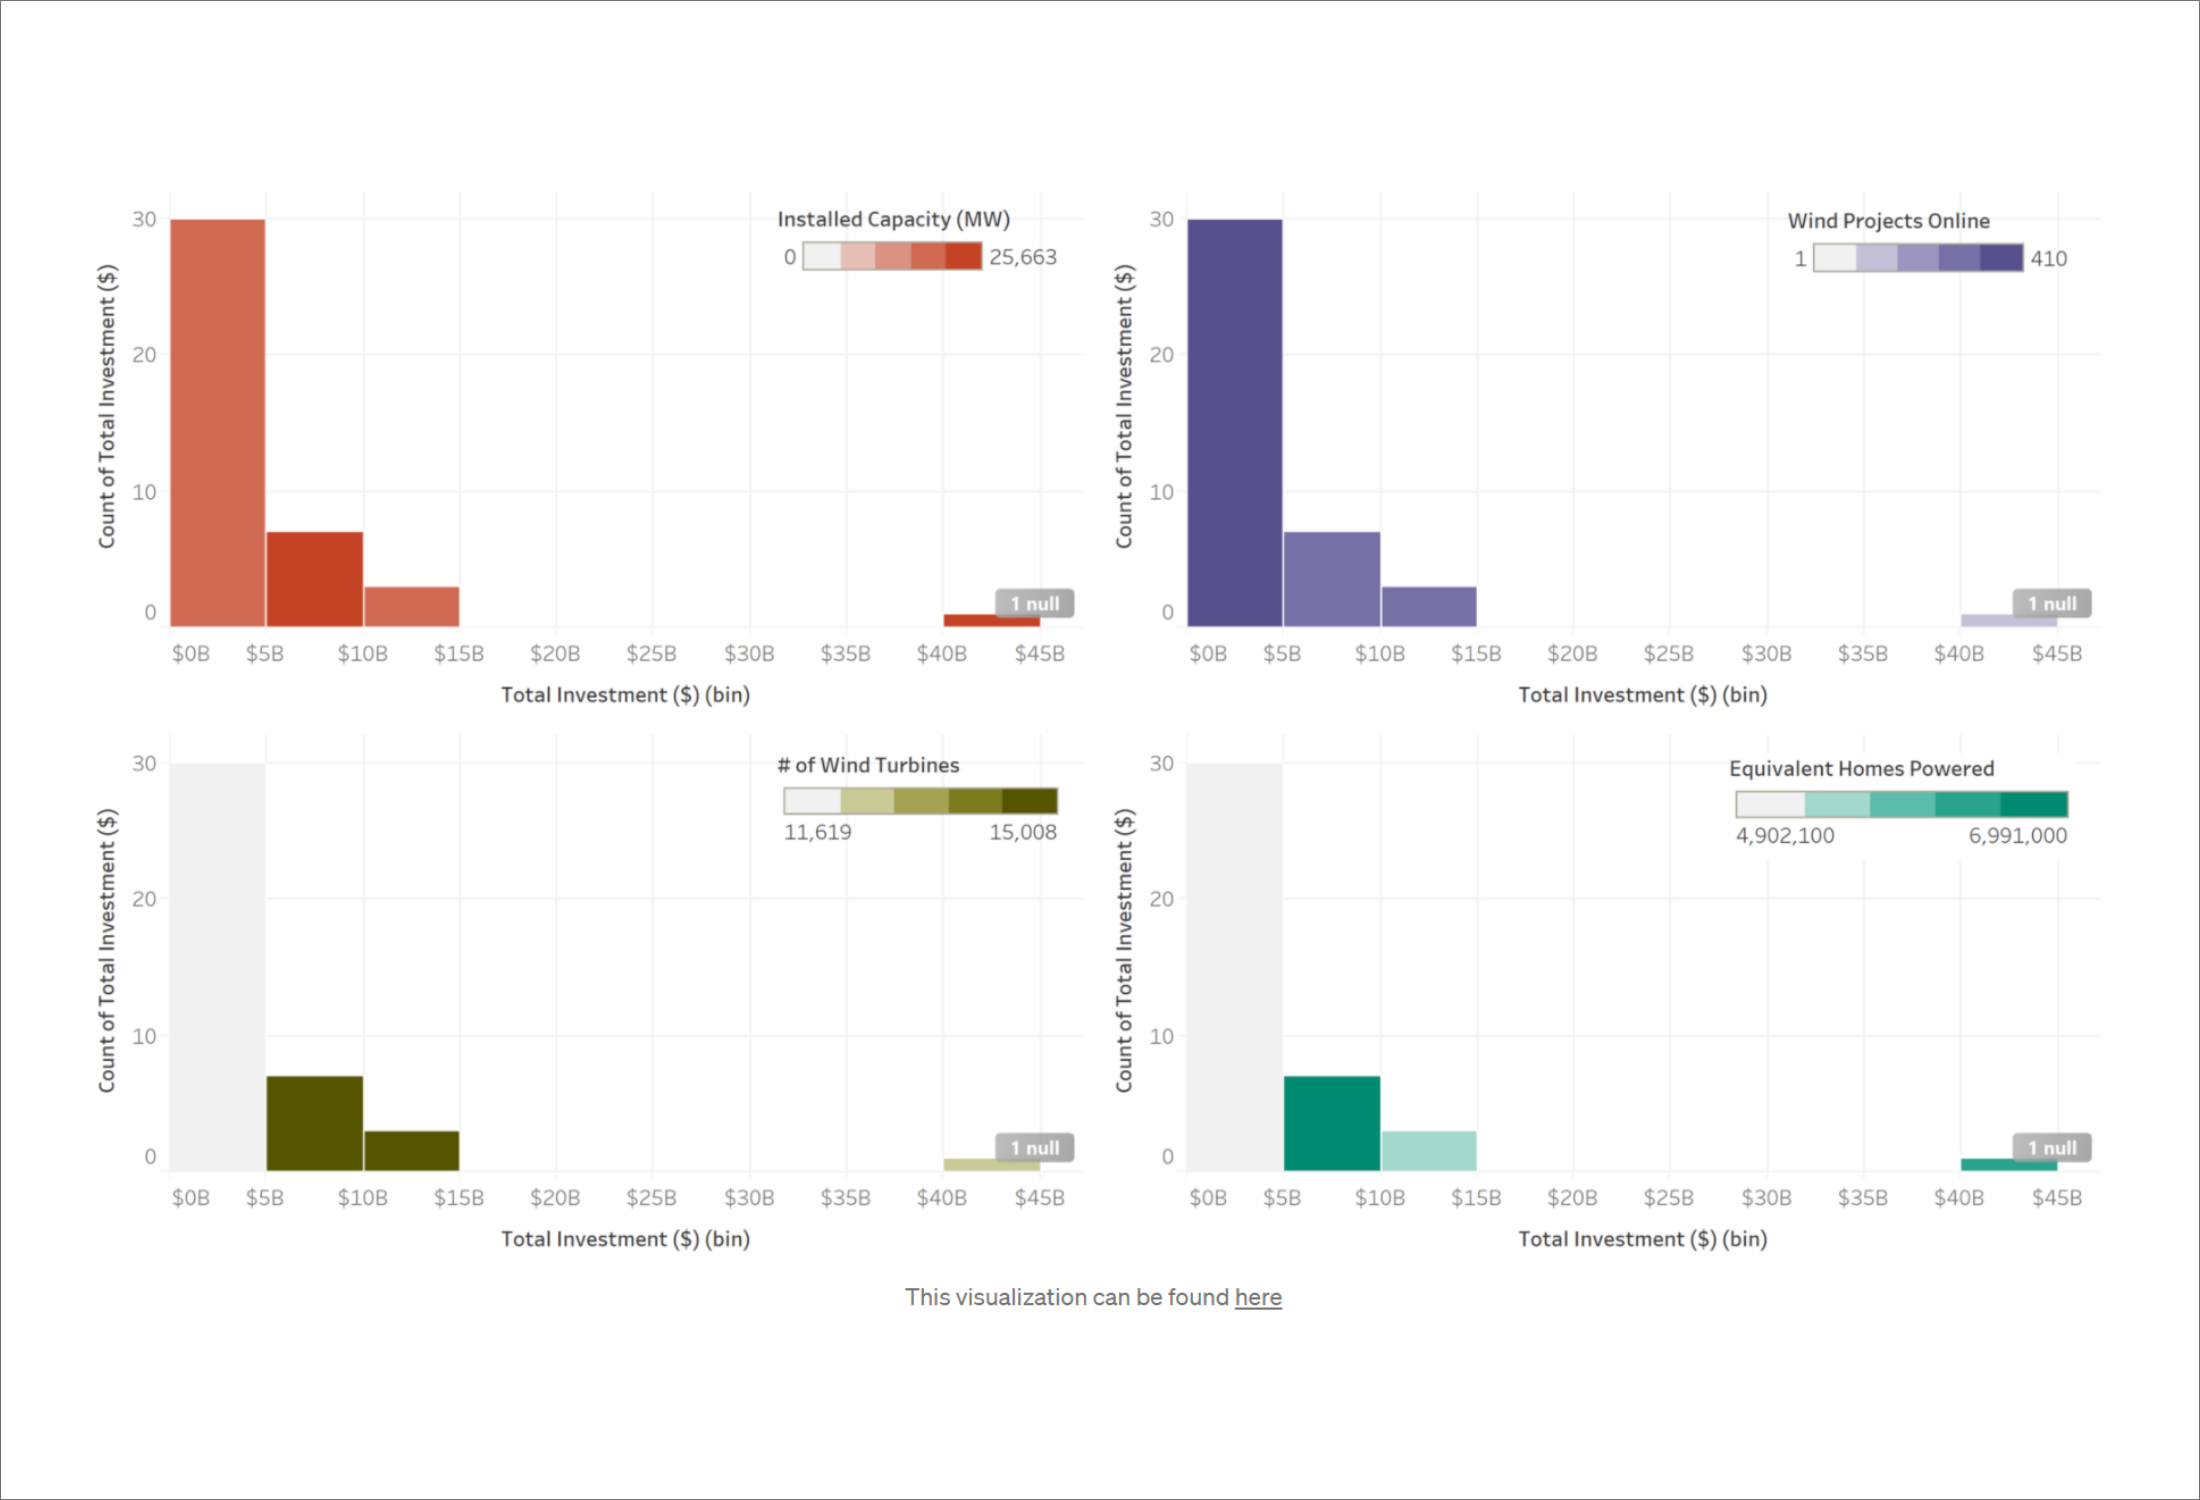
Data Visualization

Combine data, visuals, and narrative to tell impactful stories and make data-driven decisions

Data Science & Python

Learn Python, NumPy pandas, Matplotlib, PyTorch, Calculus, and Linear Algebra